ismypubfucked.com: how a side project helped make the pub crisis impossible to ignore

On Thursday 9 January, I launched a website called ismypubfucked.com. By Friday morning, 100,000 people had visited. By Monday, I was on Sky News. And on 27 January, the government announced a support package for pubs worth over a billion pounds.
I'm not claiming credit for the policy. The pub industry had been lobbying for relief for months. But there was a story buried in a government spreadsheet that wasn't getting the attention it could, and this website played a role in forcing politicians to recognise the scale of the issue.
This is how it happened.
The story hiding in the spreadsheet
In late 2025, the Valuation Office Agency published draft rateable values for 2026. These are the numbers that determine how much business rates a property pays. For pubs, the picture was grim. Rateable values were jumping 50%, 100%, sometimes 500% or more. On top of the National Insurance increases, minimum wage rises, and energy costs were already squeezing margins.
The data was all public. The VOA publishes these spreadsheets every revaluation cycle. But it was scattered across massive CSV files, with codes and reference numbers that meant nothing to anyone outside the property valuation industry. There was no way for someone to just look up their local pub and see what was coming.
So I built a site that did exactly that.
Building it
The whole thing came together in a day, working with Claude.
I run an agency that has built countless client websites and dashboards, but I'm certainly not a full-stack developer by training. I can read code, debug simple problems, and I've shipped enough side projects to know roughly what's possible. But I couldn't have built this five years ago. Probably not two years ago. The gap between having an idea and being able to execute on it has collapsed in ways that still surprise me.
The stack ended up being Next.js and React on the frontend, FastAPI on the backend, PostgreSQL with PostGIS for the database. Hosted on Vercel and Railway. I'd never used any of these tools before this project.
The real work was the data pipeline. Eight Python scripts that downloaded the VOA rating lists, parsed them, joined the 2023 and 2026 data together, fetched pub locations from OpenStreetMap, matched VOA records to actual pubs, geocoded everything, calculated what I called the "Fucked Pub Index", and loaded it all into the database.

46,000 pubs. Each one with a rateable value change, a severity score, and a location on a map.
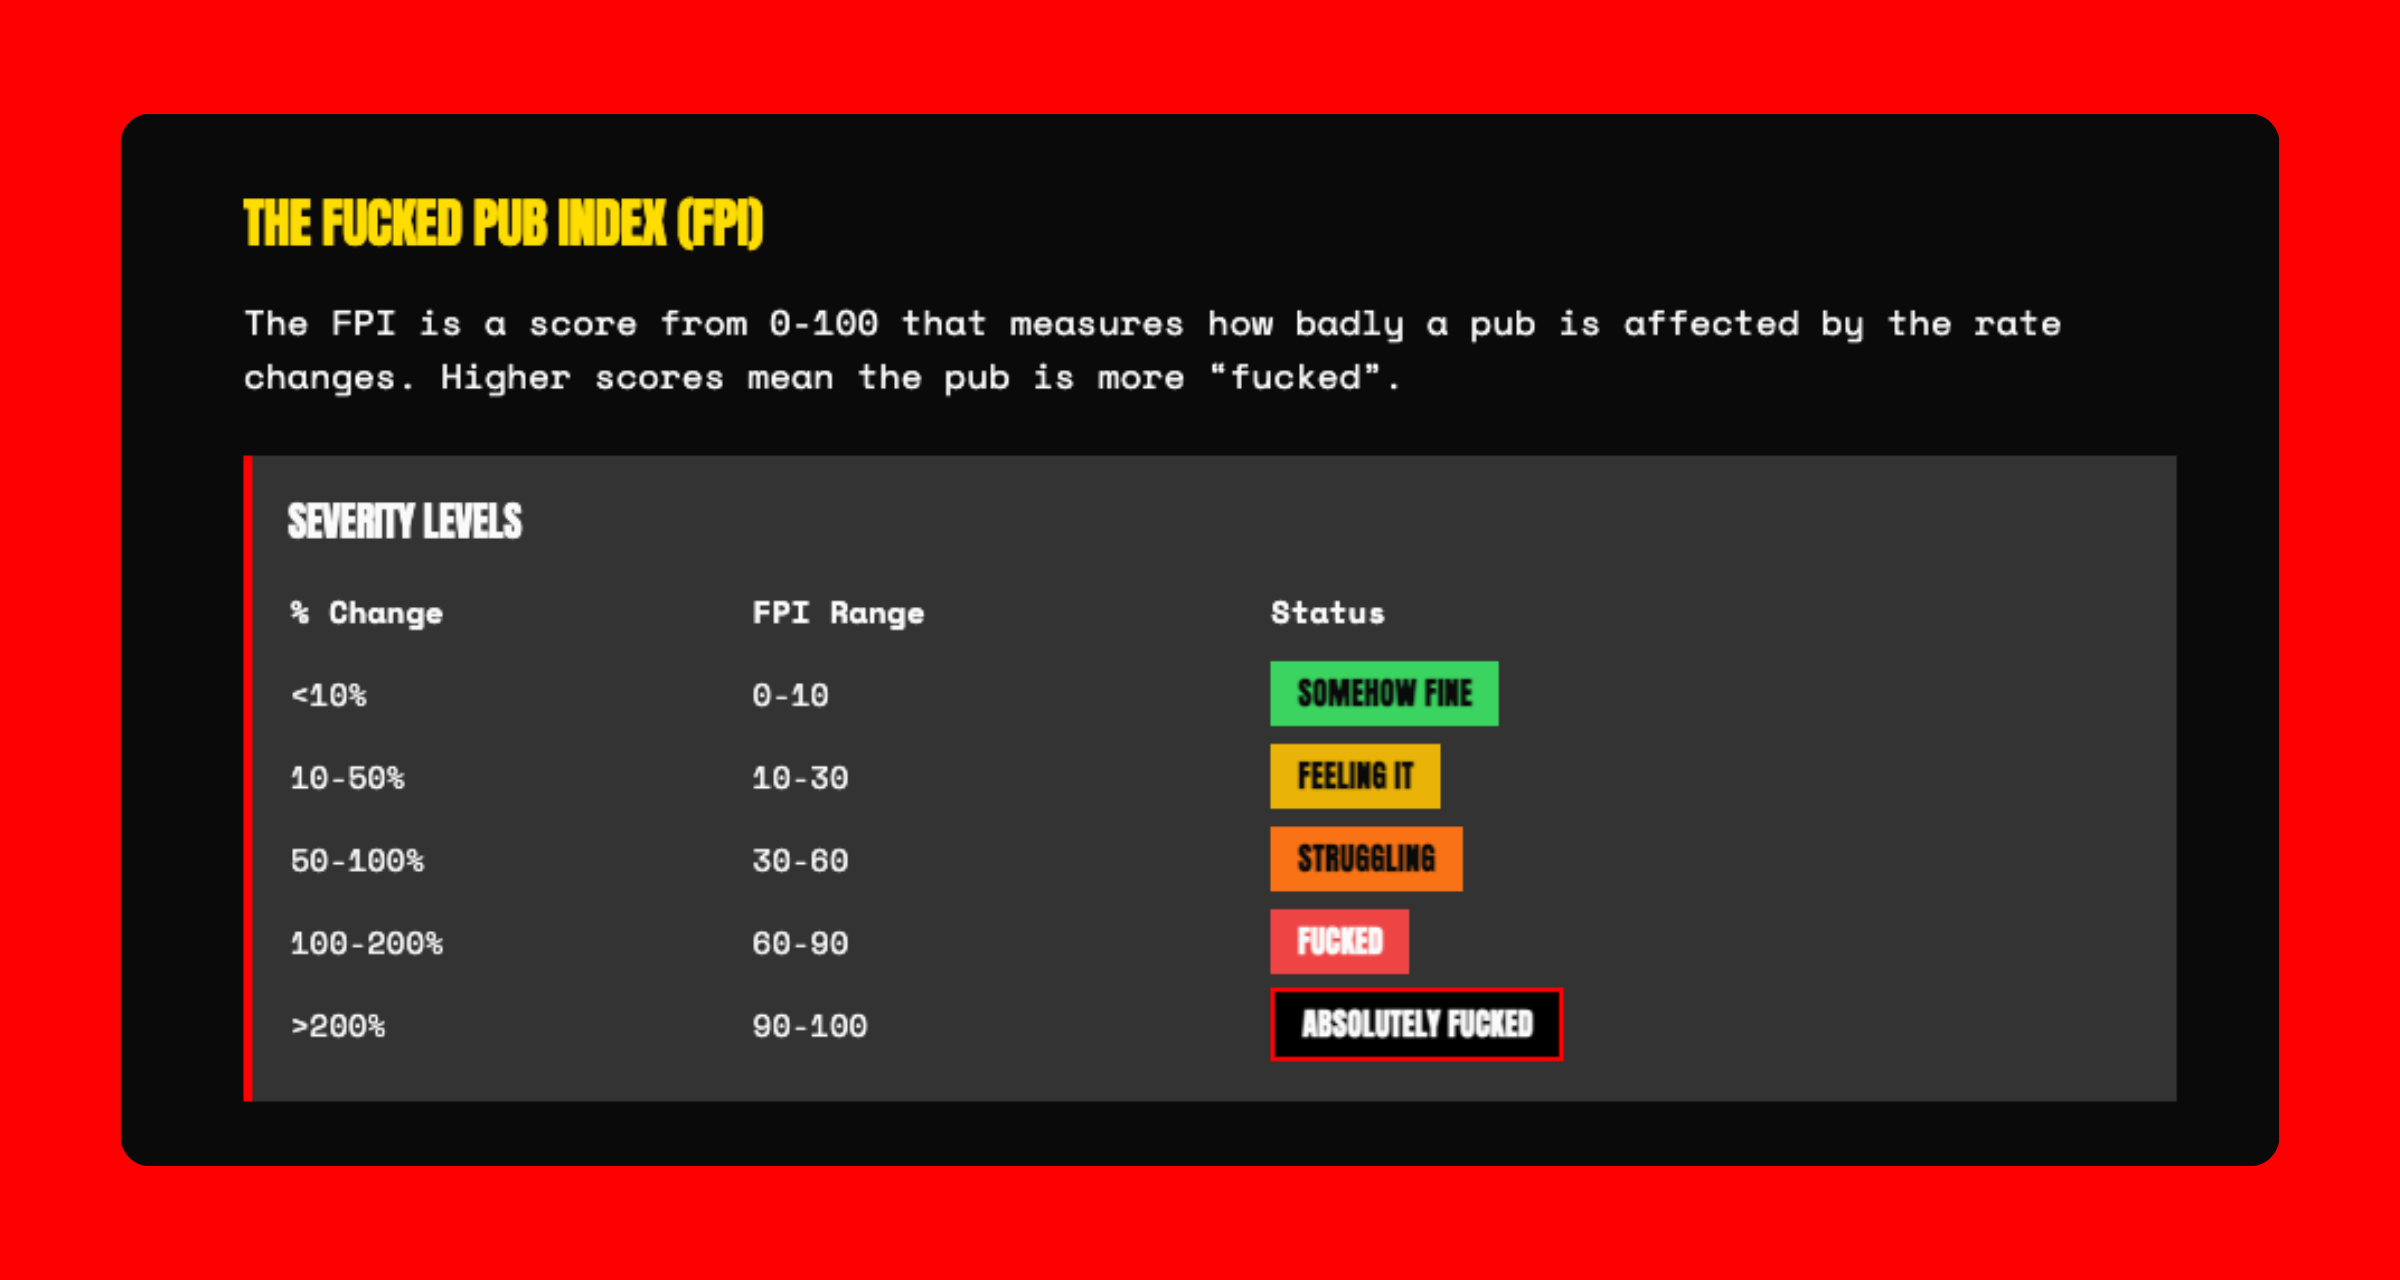
The Fucked Pub Index (FPI)
A note on the way I decided to calculate the severity score. The FPI is deliberately unscientific. It's a 0-100 score based on how much the rateable value is increasing.
- Under 10% increase = 0-10 (Somehow Fine)
- 10-50% = 10-30 (Feeling It)
- 50-100% = 30-60 (Struggling)
- 100-200% = 60-90 (Fucked)
- Over 200% = 90-100 (Absolutely Fucked)
Is this the complete picture of how business rates actually work? No. Transitional relief and small business rate relief complicate the picture considerably.
But the FPI captures the underlying pressure in a way that anyone can understand immediately. And "Fucked Pub Index" is a lot more memorable than "Rateable Value Percentage Change Indicator".
The launch
Thursday night. Tweeted the link. Went to bed. Woke up to a lot of notifications.
The thing about building a site called ismypubfucked.com is that people want to share it. The domain does half the marketing work. Someone looks up their local, sees it's "Absolutely Fucked", screenshots the result, and sends it to the group chat. The name makes it inherently shareable in a way that "UK Pub Business Rates Impact Calculator" never would be.
Within 24 hours, the site had over 100,000 page views. It was trending on Reddit, both r/unitedkingdom and r/ukpolitics. Journalists from City AM, Foodism, and local papers were reaching out.
Squashing bugs
There were naturally plenty of bugs, as you would expect in a project that took barely 6 hours from idea to a live website. Each one taught me something different.
My original code matched pubs by name across the entire country. Which meant "The Ship Inn" in Dorset was getting coordinates from "The Ship" in Shoreditch. Not very helpful if you're trying to find your local and end up 150 miles away.
The fix was obvious once I spotted it: only match OSM pubs within the same postcode. Fall back to postcode centroid geocoding if there's no match. But it took a user on Twitter pointing out that their pub was showing up in completely the wrong place before I thought of a better way to do the geolocation.
There were several others. Null handling on severity scores that crashed the page. Mobile layout overflow on the pub crawl planner. In-app browsers from Facebook and Instagram breaking the geolocation API, which required building a custom error page that told people to open it in a real browser. Each one was a small fire to put out, usually within hours of someone reporting it.
Shipping fast to leverage the attention
Once something gets attention, you have to move quickly to make the most of the opportunity.
- Sunday (12 January): TV prep. I added rate limiting, caching, SEO improvements. The site needed to survive broadcast traffic without falling over. Nothing kills momentum faster than a 502 error during a live segment.
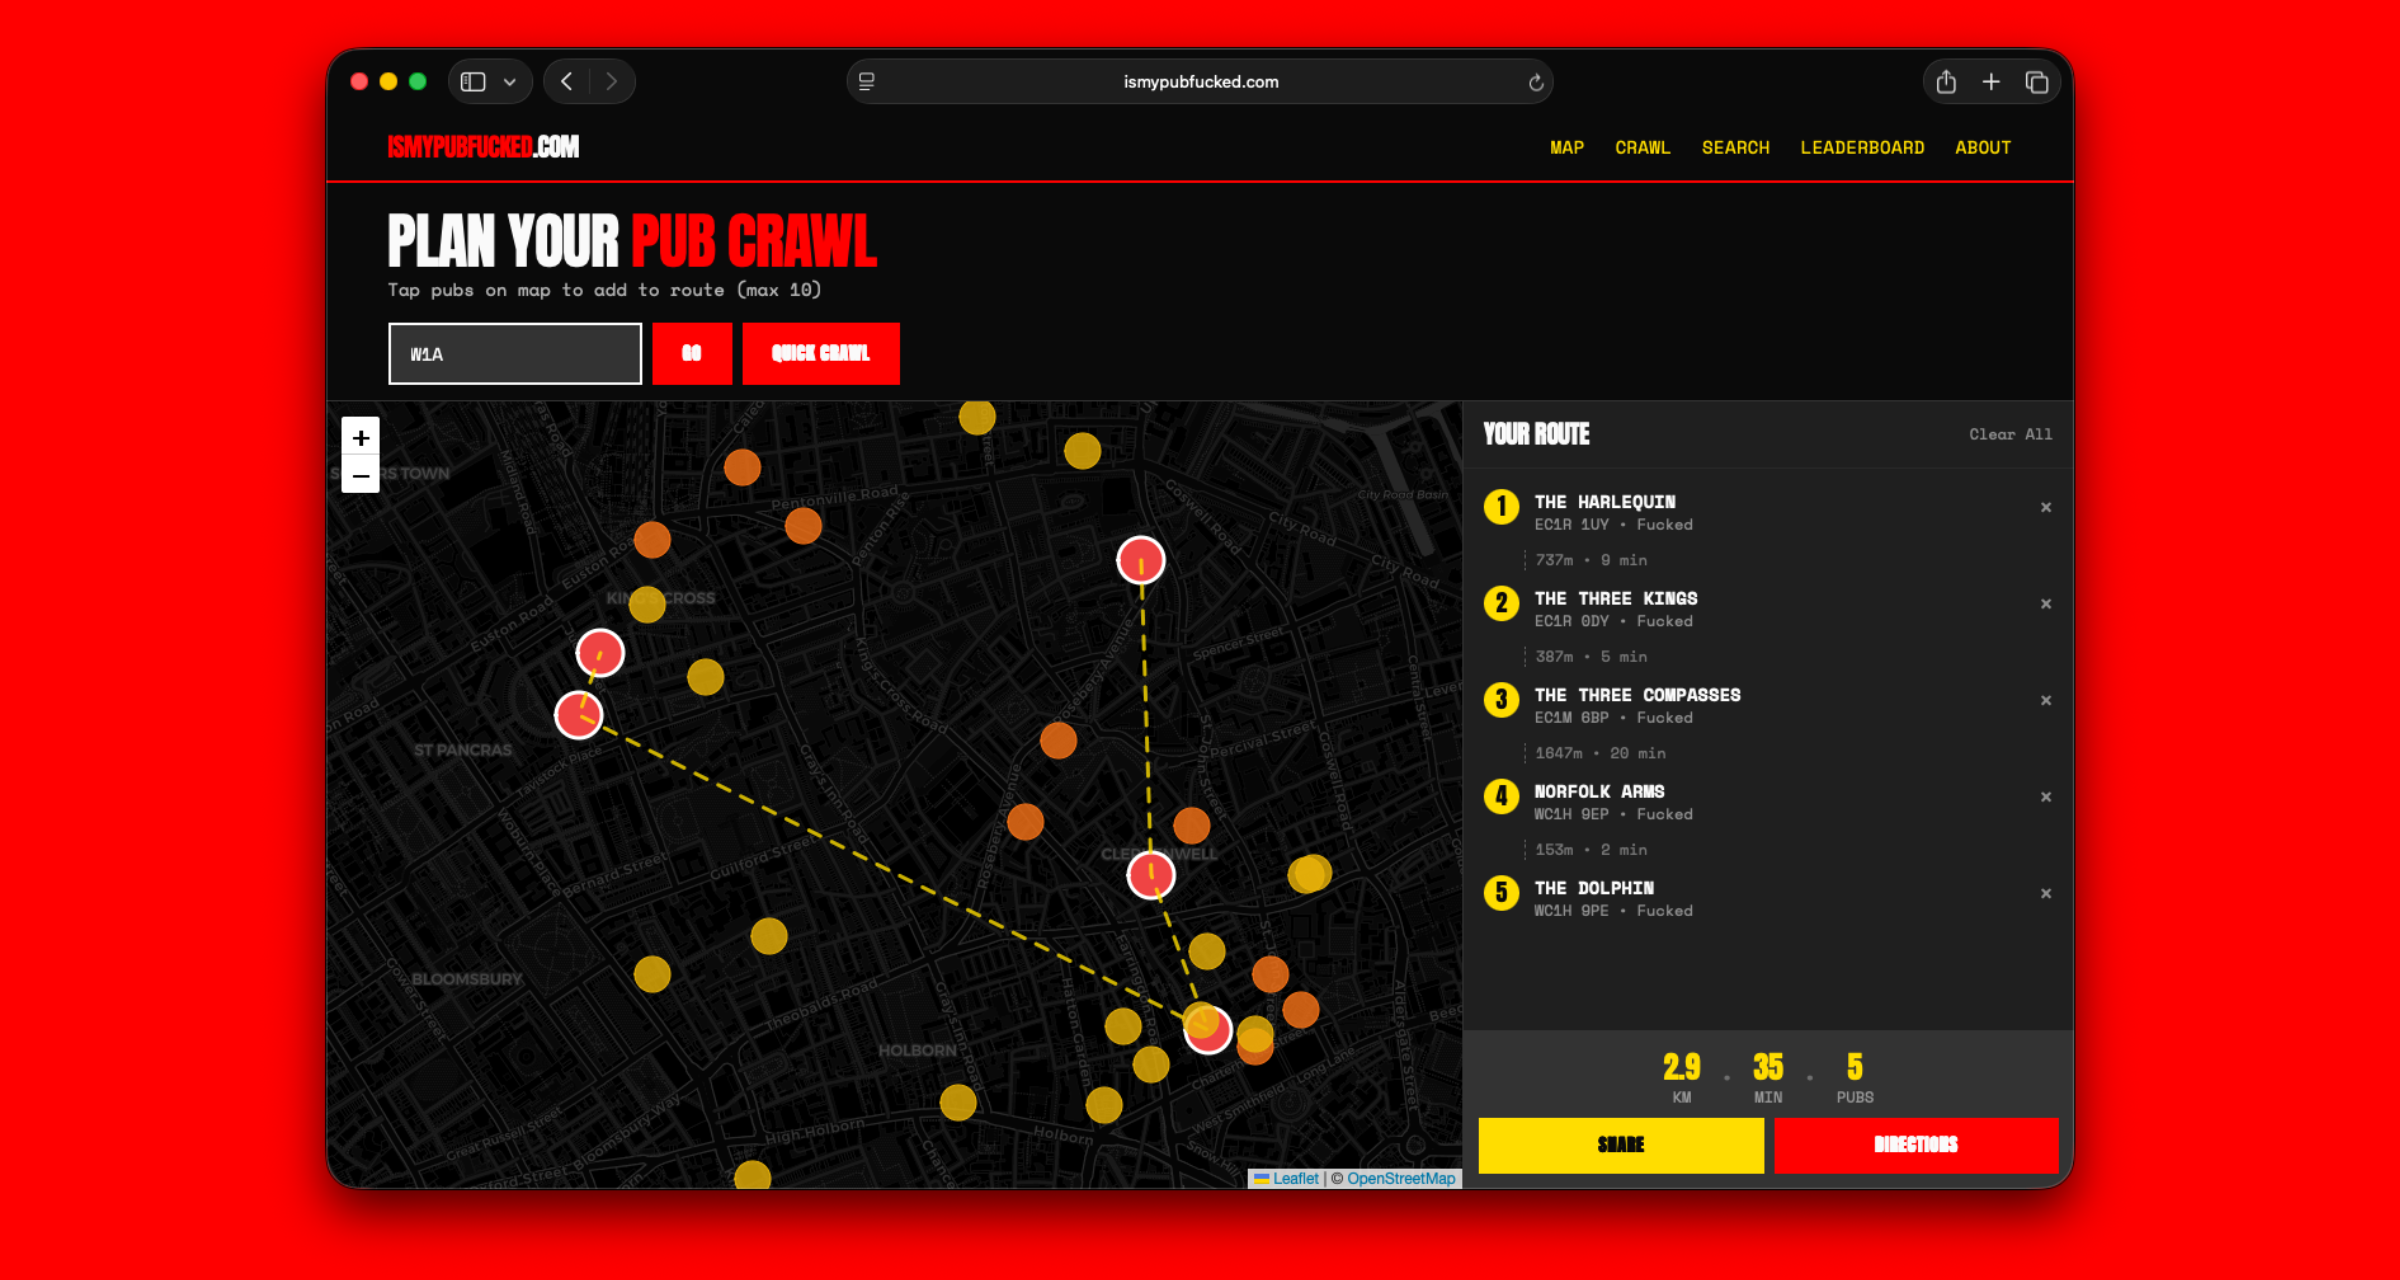
- Monday (13 January): Built a pub crawl planner. Enter a postcode, get the most fucked pubs nearby, optimised into a walking route using a Travelling Salesman approximation. This drove a second wave of sharing because now people weren't just looking up their local, they were planning nights out.
- Tuesday (14 January): Mobile improvements. Added warnings for pubs that might have closed. The VOA data includes properties that are no longer trading, and there's nothing more frustrating than trekking to a pub that shut six months ago.
- Saturday (18 January): Self-service closure reporting. Instead of relying on Twitter DMs to flag closed pubs, I built a system where users could report closures directly, one report per IP per pub, with the ability to dispute reports. Privacy-preserving and crowdsourced.
Each feature took a few hours. The hard part was already done. Once you've got the data infrastructure in place, adding new views on that data is relatively straightforward.
The coverage
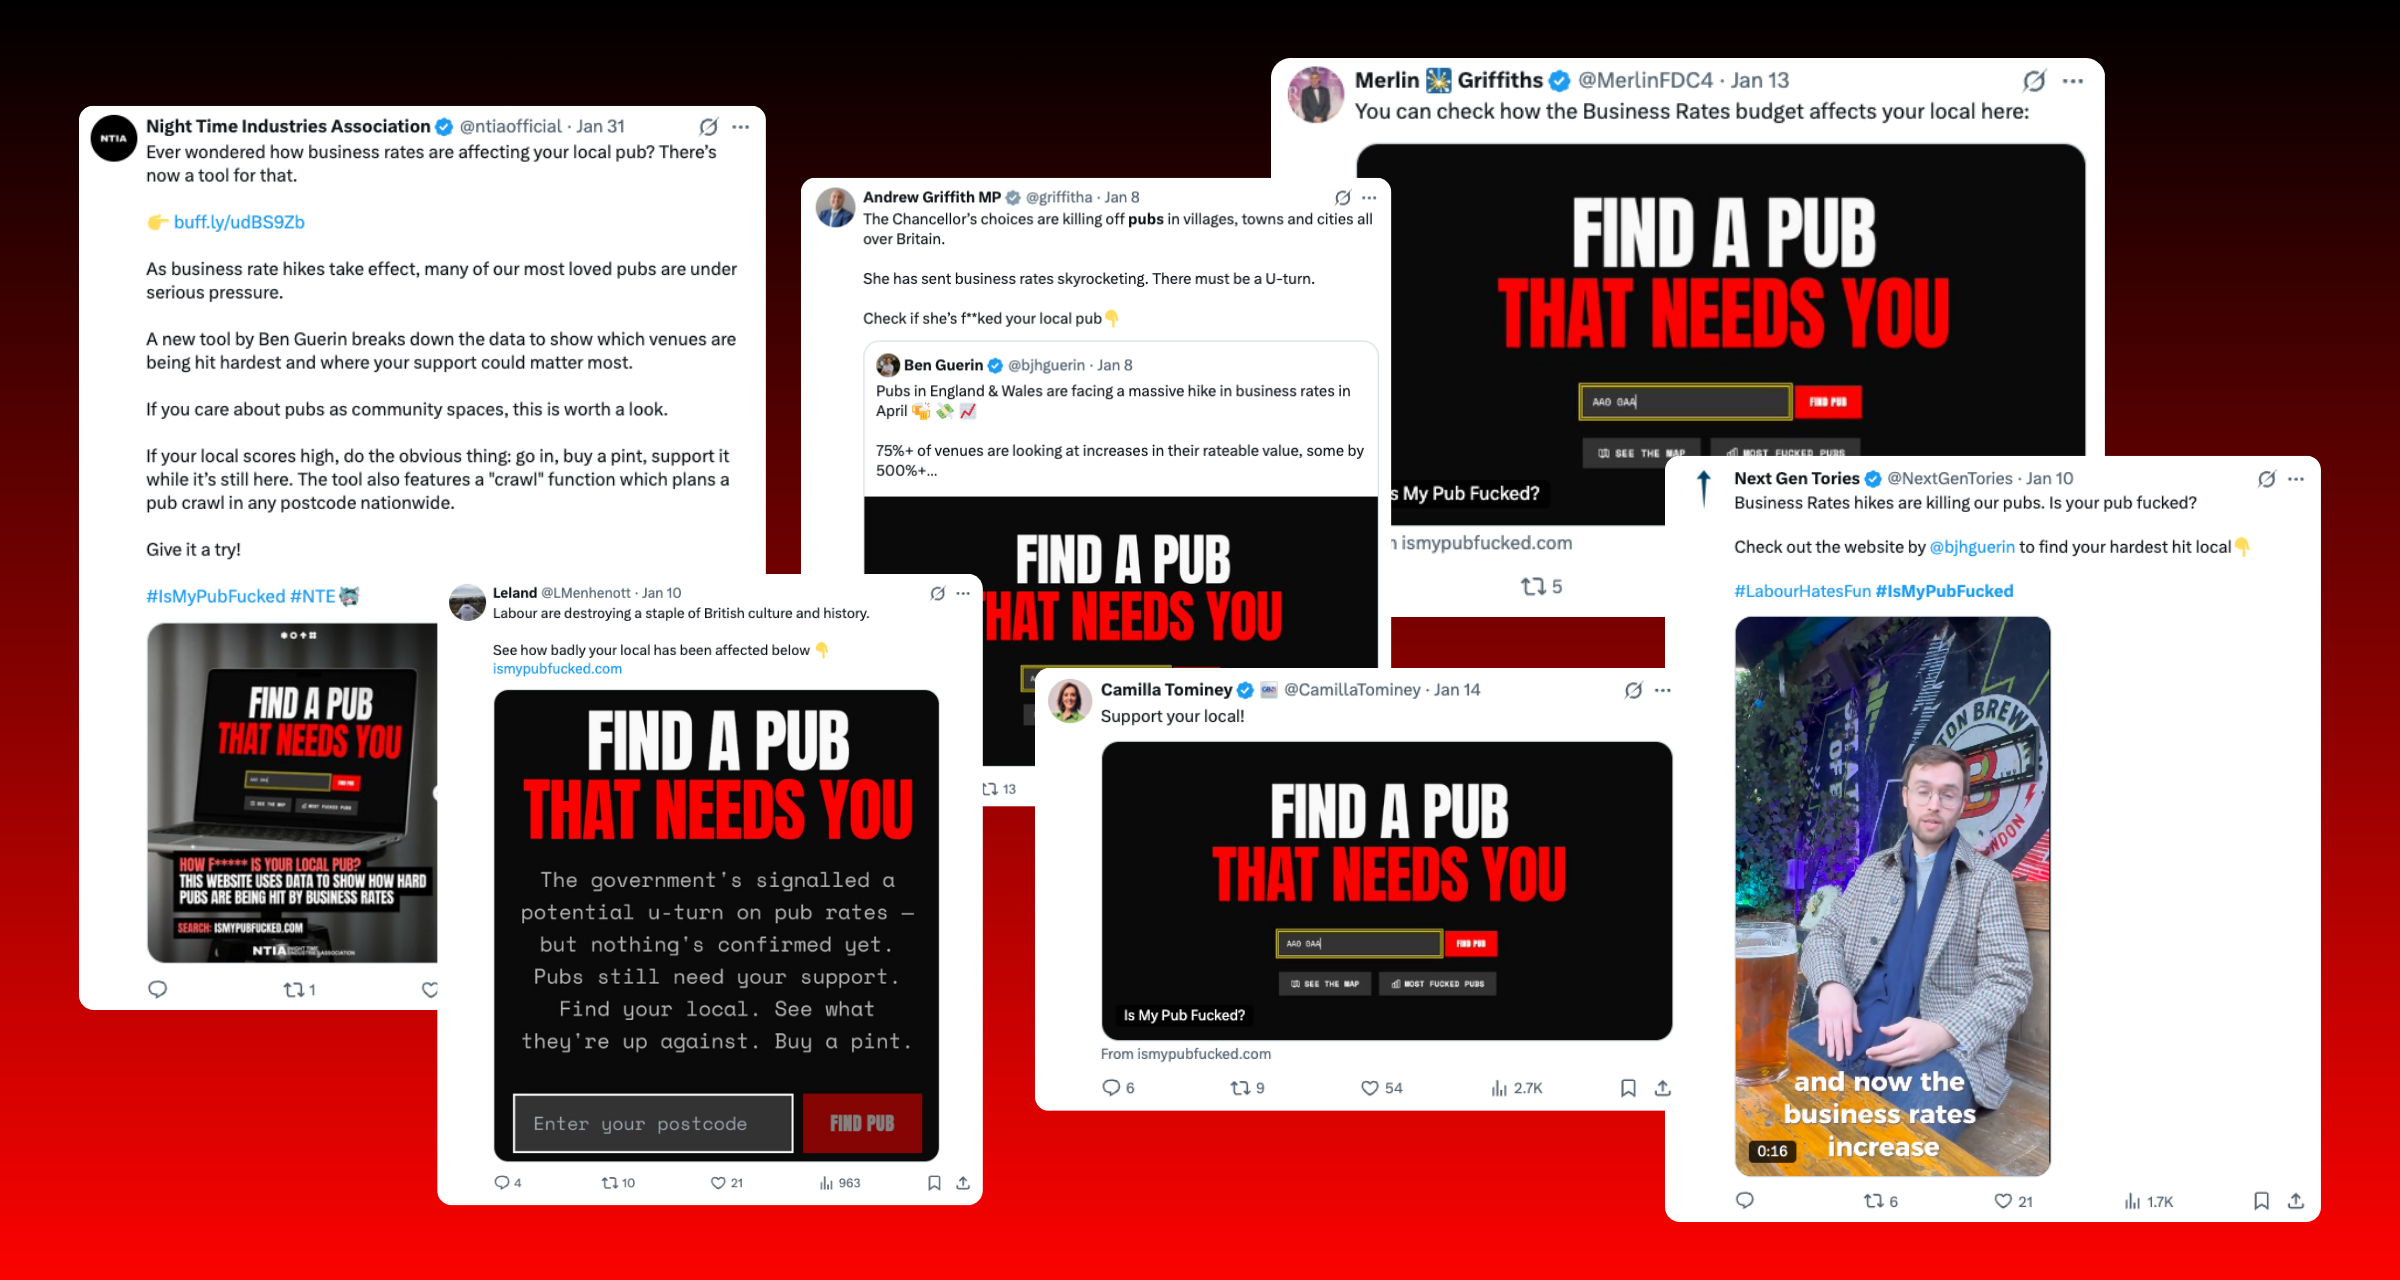
The media coverage came in waves, and I didn't pitch any of it.
City AM ran a feature and video. Foodism did a full Q&A interview. Square Mile and Yahoo News syndicated coverage. Local papers ran stories about their area's most affected pubs. GB News and Sky News both ran segments.
The Bloomberg and Telegraph pieces were tangential, about AI and productivity more broadly, but both referenced the project as an example of what's now possible for individuals to build.
The pattern was clear: the site spread because it was useful and shareable. The media coverage followed the conversation, not the other way around. Nobody needed to be convinced that pubs were under pressure. They just needed a tool that let them see it for themselves.
The policy response
On 27 January, the government announced a support package:
- 15% business rates cut from April 2026
- Two-year real-terms freeze until 2029
- Average pub saves £1,650 in 2026/27
- 75% of pubs see bills fall or stay flat
- £10 million Hospitality Support Fund
The British Beer and Pub Association, local MPs, and trade press had been making the case for months. ismypubfucked.com didn't create the pressure. But I think it helped shift the narrative by making an abstract policy problem concrete. And the owned and earned coverage it generated boosted the issue's salience.
When a Treasury official is weighing up whether to act, there's a difference between reading an industry lobby document and seeing that scores of people are looking up their local pub on a website called ismypubfucked.com and sharing the results. One is expected. The other suggests something is cutting through.
What this taught me
Here's what I keep thinking about.
The data was always public. The VOA publishes these spreadsheets every revaluation cycle. Anyone could have built this. A wiser developer with more experience could have built it faster, cleaner, with fewer bugs.
But the gap between "the data exists" and "people understand the story" is enormous. Most of the time, that gap doesn't get bridged. The spreadsheet sits on a government website, a few specialists read it, and the public conversation never happens.
What's changed is the cost of bridging that gap.
Two years ago, building ismypubfucked.com would have required either hiring a developer or spending months learning to code properly. Now it takes a day and a willingness to iterate in public.
I don't want to overstate this. Taste still matters. Knowing what's worth building, how to frame it, what will actually resonate, these are human judgments that the tools can't make for you. The implementation is the easy part now. The hard part is having something worth implementing.
At Topham Guerin, this is exactly what we think about: the intersection of storytelling, data, and the ability to build things quickly. Most of our work is for clients. But sometimes the best way to prove you can do something is to just do it yourself.
The harder question for the pub sector
The immediate policy pressure has eased. The relief package addressed the worst of it, at least until 2029.
But the underlying dynamic hasn't changed. There's public data everywhere, sitting in government spreadsheets, FOI responses, open data portals, that tells stories nobody is hearing. Most of it will stay that way because the cost of turning data into narrative has historically been too high.
That cost is collapsing. The tools to build, to visualise, to make complex things accessible, they're getting better every month. Which means more stories will get told. More pressure will be applied. More things that were easy to ignore will become impossible to ignore.
The question is who's going to tell them.
For anyone in politics, policy, or communications, this should be both exciting and uncomfortable. Exciting because the barriers to surfacing a story are lower than ever. Uncomfortable because those same tools are available to everyone else too.
ismypubfucked.com took a day to build and helped put the pub crisis on the front page. The next project like it might not be built by someone sympathetic to your cause.
The gap between data and narrative is closing. What matters now is who gets there first.
Enjoyed this? I write occasionally about politics, tech, and media.


